Effective Ways to Find Slope from Two Points
Understanding the Slope Formula
The **slope formula** is a fundamental concept in coordinate geometry that allows us to calculate the steepness or inclination of a line based on two distinct points on that line. The slope is determined through the formula: slope (m) = (change in y) / (change in x). This relationship reveals the steepness of a line, commonly referred to as **rise over run**. Essentially, this formula allows us to quantify how much the y-coordinate changes relative to changes in the x-coordinate. This concept has vast applications in various fields, such as physics, engineering, and economics.
Deriving the Slope Formula
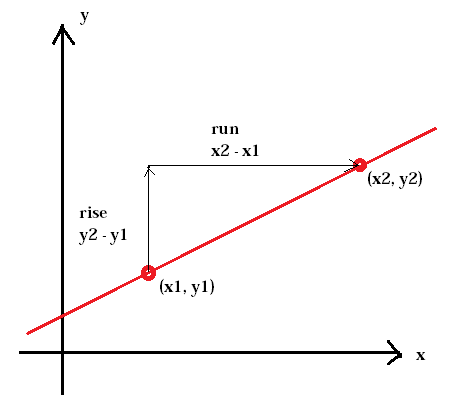
To derive the slope formula, we start by identifying two points on a graph, designated as (x1, y1) and (x2, y2). The **change in y** (or rise) is calculated as (y2 – y1), and the **change in x** (or run) is obtained through (x2 – x1). Substituting these expressions into the slope formula, we get m = (y2 – y1) / (x2 – x1). This derivation not only enhances our understanding but also aids in handling various slope calculation methods based on the scenarios we may encounter.
Applying the Slope Equation in Examples
Let’s consider an example calculation using the slope equation for the points (2, 3) and (5, 11). Here, we’ll calculate the slope between these two points. First, we identify the change in y: 11 – 3 = 8, and the change in x: 5 – 2 = 3. Plugging these values into the slope formula, we find m = 8 / 3. Therefore, the slope of the line connecting these points is 8/3, showcasing a steep rise, or **positive slope**, indicative of a line that ascends as we move from left to right.
Finding Slope from Two Points: Methods and Procedures
Finding the slope between two points can be executed through various methods depending on the context. The most straightforward approach involves directly applying the slope formula, which is crucial in linear equations. This methodology is beneficial in fields like **slope in statistics** and **slope in physics**, where linear relationships are vital for accurate modeling.
Utilizing the Rise Over Run Approach
One intuitive way to grasp the slope definition is through the **rise over run** approach. Imagine a right triangle is formed by the movement between our two points: the vertical leg represents the rise (change in y), while the horizontal leg represents the run (change in x). This visualization solidifies the relationship between these changes, emphasizing the essence of **slope measurement**. Using the earlier example, the **rise** of 8 and **run** of 3 confirms the understanding of slope and its relevance in graphing lines. If the line extended horizontally, maintaining the same y-coordinate, the slope would be zero, representing a flat line.
Benefits of Using Slope in Various Fields
The importance of slope transcends mathematical boundaries. In engineering, slope calculations determine structural integrity by ensuring safe angles for construction. In architecture, a precise understanding of line slopes assists in creating visually appealing buildings that are structurally sound. Moreover, slope applications in economics allow for the analysis of trends in data analysis. For example, calculating operators separating supply and demand on graphs often relies heavily on accurate slope measurement to ascertain operational efficiencies.
Visualizing Slope with Graphs
Graphs serve as powerful tools for understanding slope. By plotting points on a graph, one can visually assess the **slope characteristics** of the line connecting them. This visualization aids in interpreting whether a slope is positive, negative, or zero, deepening comprehension of the concept of slope and its real-life implications.
Creating Graphs of Linear Equations
Graphing serves as an excellent method for determining the slope of a line. Consider the linear equation y = (2/3)x + 1, where the slope of the line is directly inferred from the coefficient of x. By plotting this equation on the coordinate system, we can observe the gridlines representing change in y and x from any point, confirming the visual representation of **slope in real life**. Once plotted, individuals can find the slope between any two points located on the graph easily, as the change in y will always be proportional to the chosen run across the x-coordinates.
Negative and Positive Slopes Explained
Understanding negative and positive slopes is crucial in slope calculation and graphing lines. A positive slope indicates that as the x-value increases, so does the y-value, whereas a negative slope suggests an inverse relationship. For example, if the points (1, 1) and (3, 0) are plotted, the calculated slope would yield a negative value, indicating a descent of the line. This fundamental analysis assists in mathematical relationships, fostering clear communication in technical fields.
Applications of Slope in Practical Scenarios
From engineering to economics, slope finds application in diverse scenarios, impacting daily decision-making processes. Understanding slope basics can significantly improve an individual’s analytical skills across various domains, including **calculus** and data analysis. This multifaceted relevance emphasizes the need for robust knowledge of slope and its various contexts.
Slope in Statistics and Data Analysis
In statistics, the **slope in statistics** is vital for linear regression analysis. By examining the relationship between two variables via coordinated data points, one can derive the slope which tells us how one variable changes concerning another. For instance, in financial forecasts, slope may depict how revenue changes with a rise in marketing expenses, assisting decision-makers in constructing budgets. Understanding slope in various educational contexts, such as clearly illustrated slope differences between multiple datasets, empowers learners in predictive analytics.
Real-Life Applications of Slope in Engineering
In engineering, particularly when designing roads or bridges, the mathematical slope must comply with safety standards. If the slope of a road is too steep, it may become hazardous in inclement weather. Engineers utilize slope calculations to inform proper gradients that minimize risks and ensure structural stability. Slope applications also find utility in construction projects, where calculating the slope of foundations is essential in avoiding future structural damages.
Key Takeaways
- The **slope formula** allows the calculation of steepness between two points using a simple equation.
- Understanding **rise over run** provides valuable insight into how slope operates across various contexts.
- Visual representations of slope through graphs aid in grasping conceptual principles of positive and negative slopes.
- Slope has practical implications in statistics and engineering, reinforcing its significance across numerous disciplines.
FAQ
1. How can I simplify the slope calculation process?
A simplified methodology for finding slope involves utilizing the slope formula directly. Ensure that you clearly identify your coordinates and apply the change in y over change in x formula effectively. Practice across different examples will enhance speed and accuracy in your **slope calculation** process. Additionally, methods such as visual graph interpretation can further ease comprehension.
2. What are the common mistakes while finding slope?
Common pitfalls in slope calculations occur when coordinates are misread or during incorrect sign interpretation (mixing positive and negative). Additionally, confusing the order of points, which determines the direction of slope changes, often leads to errors. Using multiple practice examples will strengthen your understanding of **finding slope examples**, ultimately minimizing mistakes.
3. How is slope explained in different educational contexts?
In educational settings, slope is taught in various ways to accommodate learners. In mathematics courses, the focus is generally on computational methods such as the **slope formula** and graphing techniques. In applied courses, such as physics or engineering, slope is contextualized with real-world applications to foster better understanding and relevance. Emphasis on the **slope behavior** across different situations enhances retention differently among students.
4. What is the significance of slope in business analysis?
Slope plays a crucial role in business analysis by identifying variable relationships that inform strategic decisions. For instance, in pricing strategies, analyzing the slope of demand curves can guide pricing adjustments for maximizing revenue. By understanding **slope applications**, businesses can develop insights into market behavior and gain a competitive edge based on quantitative data.
5. How do you determine the slope of a non-linear line?
For non-linear lines, slope can change at different points along the curve. To find the slope at a specific point, one can use the derivative at that point. In practical scenarios, using calculus techniques provides insights on slopes in a much broader context. This becomes particularly significant in fields like **slope in calculus**, where variations of slope may be pertinent to analysis in complex functions.
6. How is slope represented in engineering diagrams?
Slope in engineering diagrams is typically expressed through **gradient** indicators, coding the steepness visually through graphical slopes. This representation helps engineers ascertain the correct gradient required for safety and functionality in designs. Highlighting slopes assists in effectively developing projections for structural integrity, ensuring that all calculations meet regulatory measurements and standards efficiently.
7. What resources can help improve understanding of slope?
Numerous educational resources, including online platforms, apps, and textbooks, can ground your understanding of slope effectively. Interactive graphing calculators and software like Desmos allow for hands-on experience visualizing slope relationships dynamically. Additionally, understanding technological trends in mathematics can drive greater retention of concepts related to **slope importance** in real-life applications.