How to Properly Find Standard Deviation on Excel in 2025: A Practical Guide to Accurate Data Analysis
Understanding how to compute the standard deviation in Excel is essential for anyone involved in data analysis. Whether you’re a professional statistician or someone new to data spreadsheets, grasping the nuances of using an Excel standard deviation formula is critical. This guide will walk you through the process of calculating standard deviation using various methods in Excel, complemented by practical examples and tips for optimizing your data analysis.
Understanding Standard Deviation
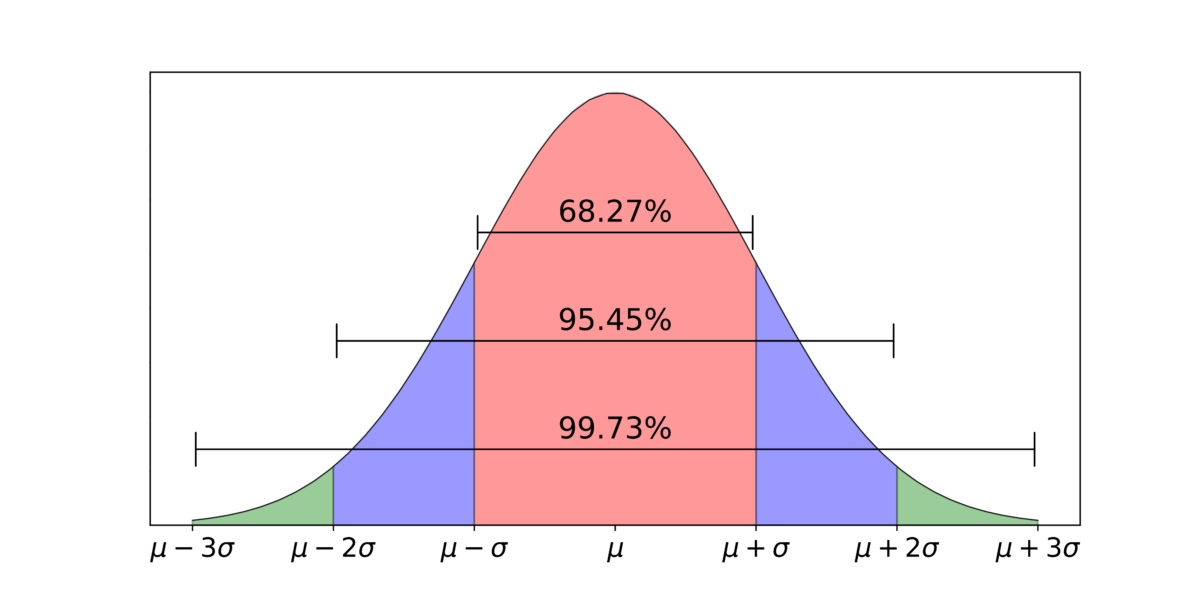
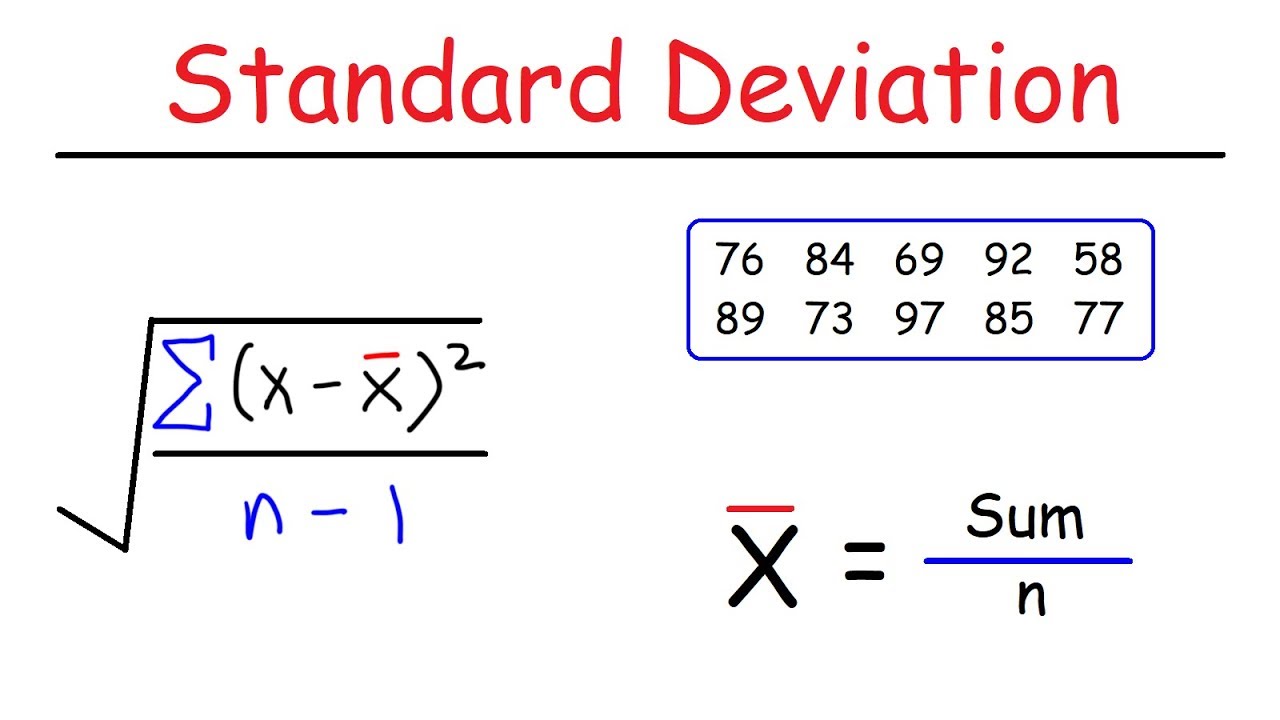
The standard deviation is a measure of the amount of variation or dispersion in a set of values. In the context of applying Excel for standard deviation, it’s important to know how it relates to other statistical concepts, such as variance. Learning to compute standard deviation accurately with tools like Excel enables you to understand data variability and interpret results effectively. You’ll uncover the significance of standard deviation in statistical analysis and make informed decisions based on your data sets.
Types of Standard Deviation in Excel
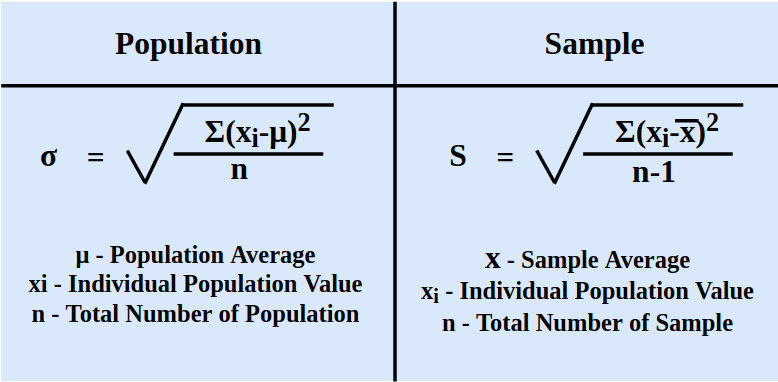
Excel provides different methods for computing the standard deviation based on the type of data you are working with. For instance, you can choose between calculating the standard deviation of a sample or an entire population. The functions STDEV.P and STDEV.S in Excel allow you to select the appropriate method. STDEV.P calculates the standard deviation based on the entire population, while STDEV.S calculates it from a sample. Understanding which one to use is key in ensuring that your analysis reflects the true variability in your data.
Working with Standard Deviation Functions
To effectively utilize Excel statistics functions, familiarize yourself with the basic formulas used in standard deviation calculations. You can input functions directly in a cell or use the Excel formula bar. For instance, enter =STDEV.P(range) for a population standard deviation or =STDEV.S(range) for a sample standard deviation. By replacing “range” with your actual data range, you can quickly retrieve results. Familiarizing yourself with these functions is crucial to refining your calculating statistics with Excel.
How to Calculate Standard Deviation in Excel
Follow these straightforward steps to calculate standard deviation using Excel’s built-in functions. Learning to navigate these formulas will enhance your excel data analysis capabilities significantly.
Step-by-Step Guide to Calculate Standard Deviation
1. **Select Your Data**: Identify the range of cells that contain the data you want to analyze for standard deviation.
2. **Choose the Formula**: Depending on whether your data represents a sample or a whole population, decide between STDEV.P or STDEV.S functions.
3. **Input the Formula**: Click into the cell where you want the result to appear and type the formula, for instance, =STDEV.S(A1:A10) if your data range is from A1 to A10.
4. **Press Enter**: Hit enter to complete, and the standard deviation value will display in your selected cell.
Following these steps will allow you to compute standard deviation in Excel confidently. The ability to interpret and utilize this data is invaluable in statistical reports and analysis.
Using Excel’s Tools for Enhanced Statistical Analysis
Excel provides additional tools for statistical measurements in Excel, such as the Data Analysis Toolpak, which simplifies complex calculations involving standard deviations. To enable this feature, go to File → Options → Add-Ins, and manage Excel Add-ins to check the Data Analysis Toolpak. Once activated, you can analyze multiple data variables efficiently and integrate advanced calculations without writing lengthy formulas.
Excel Shortcuts for Quick Calculations
In 2025, with so much emphasis on efficiency, mastering excel std deviation shortcut techniques is increasingly beneficial in speeding up calculations. Quick commands and keyboard shortcuts can save time and streamline your workflow.
Utilize Built-in Functions for Speed
Excel provides an array of built-in functions suitable for rapid calculations. Using shortcuts like auto-sum (Alt + =) when selecting a data range can help you quickly summarize multiple datasets. You can also use the Alt + H + E + S combo to format and bring clarity to your results instantly. Familiarizing yourself with these features will enhance your productivity and allow for effective statistical analyses with Excel.
Visualizing Standard Deviation in Your Data
Visualization plays a pivotal role in interpreting standard deviation. Incorporating charts, like error bars or box plots, can communicate variability visually, allowing stakeholders to grasp key insights rapidly. Excel offers straightforward methods to add these visual elements, enriching your report presentation and data analysis tools in Excel significantly.
Conclusion
Grasping how to find standard deviation in Excel in 2025 involves understanding both the functionalities within Excel and the importance of standard deviation itself in manipulating and interpreting data. From selecting the correct formula to employing shortcuts effectively, these skills empower you to make insightful decisions based on quantitative analysis. As you delve deeper into statistical concepts, the opportunities for enhancing your analysis through tools like Excel become not only beneficial but transformative.
Key Takeaways
- Understanding the types of standard deviation ensures accurate statistical analysis.
- Familiarity with Excel functions like STDEV.P and STDEV.S is crucial for effective computations.
- Utilize built-in tools and shortcuts to enhance your data analysis workflow.
- Incorporating visual representations can facilitate better understanding and communication of results.
FAQ
1. What is the difference between STDEV.P and STDEV.S in Excel?
STDEV.P is used to calculate the standard deviation of an entire population, while STDEV.S is used for a sample. Choosing the appropriate function is critical in producing accurate results when conducting your statistical analysis with Excel.
2. Can I calculate standard deviation for non-numerical data?
No, standard deviation is exclusively calculated for numerical data since it measures variability among numerical values. Ensure your data set contains valid numeric entries for successful calculations.
3. How can I visualize standard deviation in Excel?
To visualize standard deviation, you can use charts such as error bars or histograms that may represent your data sets effectively. This method enhances the interpretation of variability for your audience.
4. What are some common applications of standard deviation in Excel?
Standard deviation can be used in various applications such as in finance for portfolio risk assessment, quality control in manufacturing, and in social sciences for understanding data distributions.
5. Is there a way to automate standard deviation calculations in Excel?
Yes, you can use VBA programming to automate standard deviation calculations, allowing for more advanced data analysis. This method is valuable when dealing with large datasets requiring frequent calculations.