Effective Ways to Find the Rate of Change in 2025
Understanding the Rate of Change
The rate of change is a fundamental concept in mathematics, particularly within calculus. It refers to how a quantity changes in relation to another variable over a specific interval. Whether you’re dealing with functions or analyzing trends in data, understanding this concept is crucial for accurate measurements in various fields, including physics, economics, and statistics. In this section, we will delve into the average rate of change and the instantaneous rate of change, highlighting their significance and differences.
Average Rate of Change
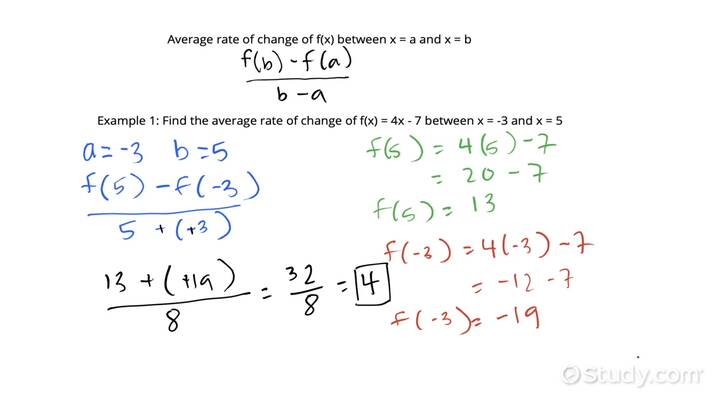
The average rate of change measures how much a function’s value changes, on average, over a specified interval. Mathematically, it can be represented using the rate of change formula which is given by:
\[\text{Average Rate of Change} = \frac{f(b) – f(a)}{b – a}\]
In this formula, \(f(a)\) and \(f(b)\) denote the values of the function at points \(a\) and \(b\), respectively. This method is often visualized using the secant line, which connects two points on the graph of the function, providing a clear representation of the change observed over the interval. For example, in a population growth study, if the population increased from 1,000 to 1,500 over five years, the average rate of change would be:
\[ \frac{1500 – 1000}{5} = 100 \text{ people per year}\]
Instantaneous Rate of Change
The instantaneous rate of change, on the other hand, reflects how a function changes at a specific instant. This concept can be mathematically understood as the limit of the average rate of change as the interval approaches zero. This behaves similarly to the slope of the tangent line to the curve at a specific point. To calculate this, we use the derivative:
\[\text{Instantaneous Rate of Change} = \lim_{h \to 0} \frac{f(x+h) – f(x)}{h}\]
This is particularly powerful in physics, where it can be used to find velocities at precise moments. For instance, if the position of an object is given by a function \(s(t)\), the instantaneous rate of change would yield the object’s velocity at any given time \(t\).
Applications of Rate of Change
The concept of rate of change has a multitude of applications across various fields. From measuring trends in economics to identifying variations in scientific data, its applicability is vast. In this section, we will discuss real-world examples and applications in physics and mathematics.
Rate of Change in Physics
Understanding the rate of change in physics is crucial for analyzing motion and forces. For instance, considering Newton’s laws, the instantaneous rate of change of an object’s position refers to its velocity, and further change with respect to time can give acceleration. The relationship can be derived through derivatives, allowing for precise calculations in dynamic systems. For example, if a car’s position is defined by the function \(s(t) = 5t^2\), differentiating yields:
\[\frac{ds}{dt} = 10t\]
This shows the velocity changes continuously with time.
Rate of Change in Economics
In economics, the concept of economic rate of change plays a crucial role in assessing performance metrics, such as GDP growth or inflation rates. By understanding the average rate of change over time, economists can model market trends, make predictions about future performance, and apply this understanding to optimize resources. For example, if a business’s revenue increases from $10,000 to $15,000 over three years, the average rate of change tells analysts how the company is performing on a yearly basis, providing insights for strategic planning.
Graphical Interpretation of Rate of Change
Graphing functions offers a visual representation of the rate of change, making it easier for students and professionals to understand and analyze functional relationships. This section will focus on how to interpret changes graphically.
Graphing Rate of Change in Functions
When creating graphs, the rate of change in graphs can be portrayed through slopes of lines connecting points. The direction and steepness of the line provide intuitive information about how quickly the function is changing. An increasing function will appear as a line sloping upwards from left to right, indicating a positive rate of change, whereas a decreasing function will slope downwards, hinting a negative rate. Understanding these slopes can guide decisions in various contexts, such as determining whether a business is growing or shrinking based on financial data.
Using Derivatives for Graph Analysis
Utilizing the concept of differentiation, you can analyze the behavior of functions effectively. Derivatives allow for deeper insights into where a function is increasing, decreasing, or remains constant. For example:
\[f'(x) = 3x^2 – 6x + 2\]
By finding intervals where \(f'(x) > 0\) or \(f'(x) < 0\), you can pinpoint regions where the function is increasing or decreasing, further assisting in the understanding of trends and changes in data.
Tips for Calculating Rate of Change
To effectively calculate rates of change across different scenarios, applying certain strategies can enhance accuracy and efficiency. Here we offer some practical tips on calculating powers of change in functions.
Step-by-Step Calculus Tips
When delving into calculating the rate of change, following systematic steps can yield the best outcomes:
- Identify the function you are working with and the points of interest.
- For average rates, compute the values at the endpoints of your interval.
- Utilize the rate of change formula for calculating average rates or apply limits for instantaneous change.
- Graph the function or utilize a derivative if necessary to visualize the change effectively.
- Don’t forget to interpret the significance of the calculated rates in practical scenarios.
Leveraging Technological Tools
For those who find complex calculations laborious, numerous online tools and software programs can help in finding the rate of change. Programs such as Desmos and graphing calculators enable users to easily visualize functions, calculate derivatives, and experiment with different mathematical models. Utilizing these tools can significantly simplify your productivity and effectiveness in analyses.
Key Takeaways
- The rate of change measures how a quantity varies with respect to another variable.
- Average and instantaneous rates of change have distinct applications in mathematics and physics.
- Understanding how to interpret graphs significantly aids in analyzing trends and making predictions.
- Employing structured steps and technological tools will facilitate the calculation process and improve accuracy.
FAQ
1. What is the difference between average and instantaneous rate of change?
The average rate of change quantifies how much a function changes over an interval, calculated over two points, while the instantaneous rate of change gives the rate at which a quantity changes at a specific point, equivalent to the slope of the tangent line of the function at that point.
2. How do I find the derivative?
To find the derivative of a function, apply differentiation rules based on the function form, such as power, product, or quotient rules. These rules will guide you to determine the function’s rate of change at any specific point.
3. What are some real-world applications of the rate of change?
Applications include measuring variables such as speed in physics, economic growth rates in finance, and monitoring population changes in demographics. Understanding rates allows for insightful analysis and forecasting in diverse fields.
4. Can you provide an example of rate of change in a graph?
In a graph depicting sales growth over time, a steeper slope indicates a higher rate of increase in sales, while a flatter slope suggests minimal growth. By analyzing the slope between two points, we can determine the average rate of change for that period.
5. How is rate of change related to limits?
The concept of the instantaneous rate of change involves taking the limit of the average rate of change as the interval approaches zero. This connection underlies many calculus operations and is essential for derivative calculations.
6. Why is the rate of change important in statistical analysis?
The rate of change is crucial for understanding trends, predicting future patterns, and conducting sensitivity analyses, enabling better decision-making based on data interpretation.
7. How can I visualize the rate of change in practical scenarios?
Visualizing rate of change involves using graphs to display functional behavior. By plotting inputs against outputs, slopes of secant and tangent lines reveal the nature of change, making it easier to comprehend complex relationships in data.