Simple Guide to Calculate Standard Deviation in Excel for Accurate Data Analysis in 2025
In today’s data-driven world, understanding how to perform analyses in Excel is crucial. One key statistical measure you may need to calculate is the **standard deviation**. This guide will walk you through the various ways to calculate standard deviation in Excel, helping you to conduct effective data analysis and interpret your data accurately.
Understanding Standard Deviation in Excel
The **standard deviation** is a statistic that measures the amount of variation or dispersion in a set of values. In Excel, grasping this concept is essential for performing **data analysis**. The closer the standard deviation is to zero, the less spread out the data points are from the mean. This metric is widely used in fields like finance, academic research, and business statistics to gauge **data variability** and risk. Let’s explore how to effectively calculate the standard deviation using Excel.
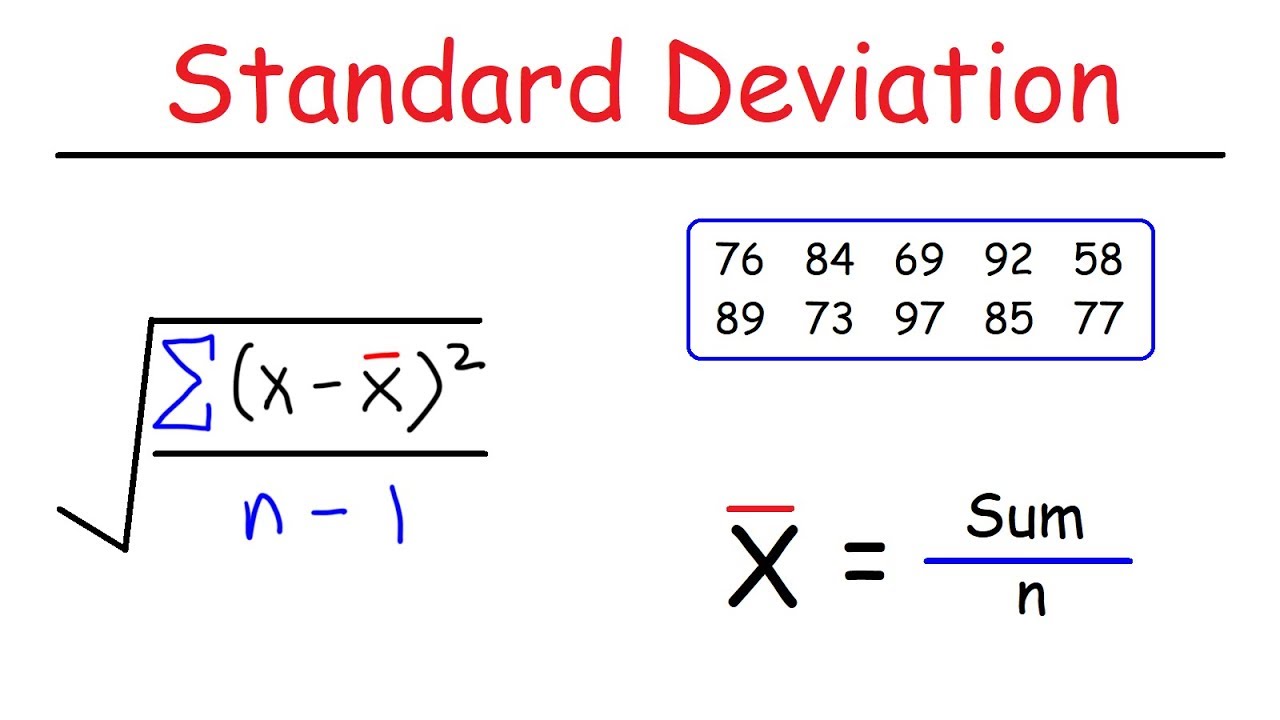
The Basic Definition of Standard Deviation
The standard deviation reveals how data points distance themselves from the mean of a dataset. For example, in an Excel spreadsheet containing test scores, a low standard deviation implies that students scored similarly around the average, while a high standard deviation indicates wide disparities among scores. To calculate the **standard deviation** efficiently in Excel, you’ll need to utilize specific functions designed for this purpose. Familiarizing yourself with these functionalities will enhance your accurate data analysis skills.
Excel Standard Deviation Functions
Excel provides several functions to calculate standard deviation, primarily STDEV.P for the entire population and STDEV.S for a sample of the population. Using these functions correctly ensures accurate data analysis. For instance, if you have a more extensive dataset representing an entire population, using STDEV.P is advisable; on the other hand, when working with sample data, STDEV.S is the right choice.
Practical Example: Calculating Standard Deviation
To demonstrate how to calculate standard deviation in Excel, consider an example dataset consisting of sales numbers over six months. You would input these numbers into a spreadsheet and apply the STDEV.S function. The formula in Excel would look like this: =STDEV.S(A1:A6), where A1:A6 represents the range of cells containing your data. By pressing Enter, Excel calculates the standard deviation, providing essential insights into variances in sales trends.
Using Standard Deviation for Data Analysis in Excel
Incorporating standard deviation into your spreadsheets is incredibly valuable when analyzing trends. Understanding how to use this measure can enhance your capacity to make informed decisions based on statistical data. With standard deviation calculations, you can identify which values significantly deviate from the mean and interpret their impact on overall performance metrics.
Creating Visualizations with Standard Deviation
A powerful feature of Excel is the ability to create charts that visually represent data variability. By plotting data points alongside the standard deviation, you can visualize how dispersed or closely related your data is to the average. This visualization aids in understanding significant fluctuations and trends, thus improving your **data analysis** capabilities. Utilizing **Excel charts** allows a clear depiction of the **standard deviation**, making it easier to present results visually.
Interpreting Results from Standard Deviation Calculations
Once you compute the standard deviation using Excel, interpreting the results becomes essential. A standard deviation value indicates whether your data points cluster near the mean or spread out widely. For example, a value of zero indicates all values are the same. A larger value signifies a high level of variation. By routinely implementing standard deviation metrics, you can enhance your **business analysis** strategies and more effectively identify performance trends.
Best Practices for Calculating Standard Deviation
To ensure accuracy when calculating standard deviation in Excel, adhere to several best practices: verify the data structures, utilize the appropriate Excel functions (STDEV.P or STDEV.S), and confirm that your formulas are accurately applied. Additionally, consider maintaining organized data inputs, as this reduces potential errors in your calculations. Employing these measures will significantly benefit your **data management** tasks in Excel.
Advanced Excel Techniques for Statistical Analysis
Delve deeper into using **Standard Deviation** and other statistical tools provided by Excel for advanced data analysis. Whether your needs are related to **financial analysis** or **academic research**, Excel’s functionalities allow you to streamline complex calculations and understand data distributions more comprehensively.
Excel Analysis ToolPak for Advanced Statistics
For users requiring more in-depth statistical analysis, engaging the **Excel Analysis ToolPak** can be a wise decision. This add-in provides access to advanced statistical functions, including regression analysis and ANOVA. With access to these features, you can conduct broader analyses and apply various statistical techniques that extend beyond simple standard deviation calculations.
Combining Functions for Enhanced Insights
It’s possible to combine standard deviation computations with other Excel functions for deeper insights. For example, leveraging the **AVERAGE** function alongside the standard deviation can produce summary statistics that compile **mean**, **standard deviation**, and other metrics, combined into a cohesive analysis. This technique enables you to beautifully articulate your analysis to stakeholders or use it in reports.
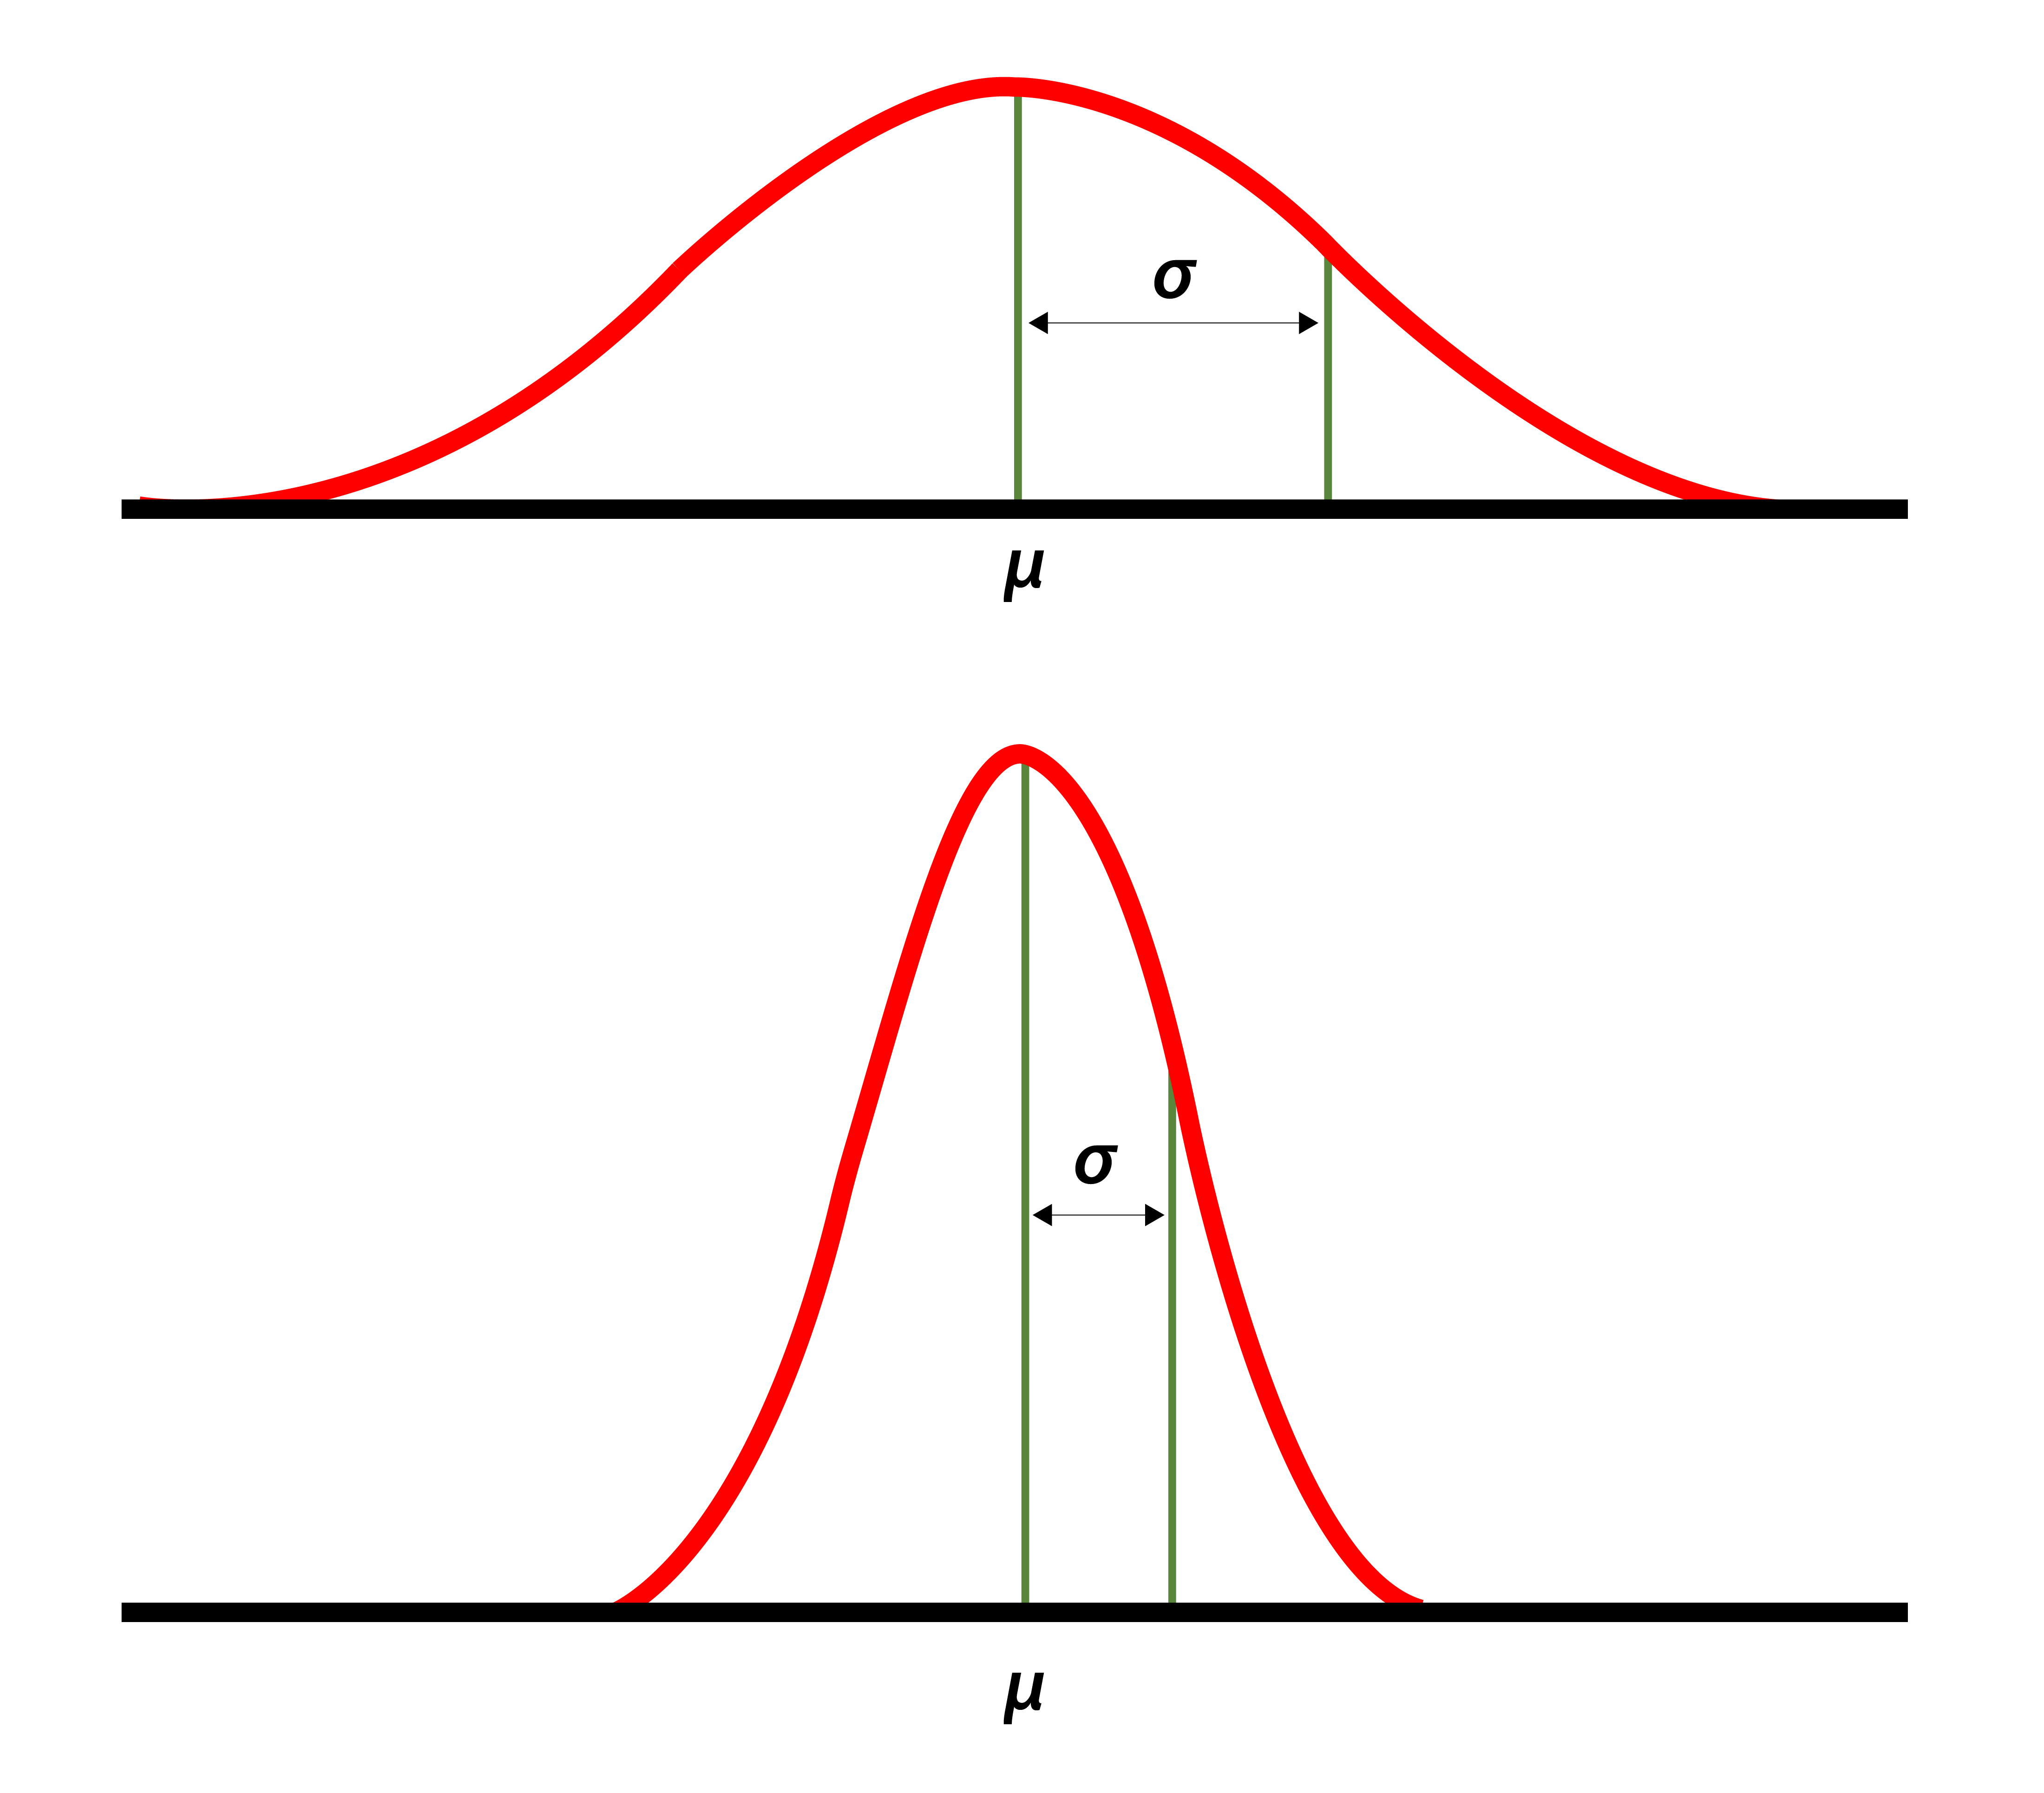
Statistical Distributions and Standard Deviation
Understanding how **standard deviation** interacts with various statistical distributions enhances your data interpretation capabilities. In a normal distribution, for example, about 68% of data points fall within one standard deviation of the mean. Using such insights can lead to better forecasting and risk management in **business statistics** and scientific studies alike. Recognizing these patterns in your Excel data sets can inform better decisions and project outcomes.
Key Takeaways
- Utilize the appropriate Excel functions for calculating standard deviation—STDEV.P for population data and STDEV.S for samples.
- Interpreting standard deviation aids in evaluating data spread and making informed statistical inferences.
- Leverage Excel charting tools to visualize data alongside standard deviation measures for clearer reporting.
- Employ best practices and the Analysis ToolPak for advanced statistical tasks.
FAQ
1. What is standard deviation, and how is it useful in Excel?
Standard deviation is a measure of data variability, helping quantify how much individual data points deviate from the mean. In Excel, calculating standard deviation allows users to evaluate data trends effectively, derive insights, and make justified decisions based on statistical analysis.
2. How can I visualize standard deviation in Excel spreadsheets?
To visualize standard deviation in Excel, you can use chart functions such as line charts or scatter plots. By plotting your data points and adding your standard deviation values as error bars, you create a visual indicator of variability that enhances your data analysis insights.
3. What are some common errors to avoid when calculating standard deviation in Excel?
Common errors include selecting the wrong standard deviation function (STDEV.S vs STDEV.P), inputting ranges incorrectly, and failing to verify that the dataset correctly represents the population or sample required for your analysis.
4. How do I interpret a high standard deviation value?
A high standard deviation indicates that data points are widely dispersed around the mean. This means there is a significant variation within the set, which could suggest underlying factors influencing the results that may warrant further investigation.
5. Can I automate standard deviation calculations in Excel?
Yes, you can automate standard deviation calculations by utilizing Excel macros or functions that apply to dynamic datasets. This ensures efficient updates and reduces manual errors in your calculations, streamlining your data analysis processes.
6. How can Excel help in understanding the spread of data?
Excel assists in understanding data spread through functionalities that enable users to calculate summary statistics such as mean and standard deviation. By integrating these tools, analysts can visualize and interpret data distributions effectively, leading to more informed decision-making.
7. Where can I find more resources for learning about standard deviation in Excel?
For more comprehensive guidance and tutorials, exploring resources like the Excel help documentation or online tutorials on platforms like YouTube or educational sites can be highly beneficial. These resources often provide step-by-step support for mastering Excel’s statistical functions.