
Understanding Standard Deviation: A Practical Guide to Enhance Your Statistical Skills
Mastering standard deviation is essential for anyone looking to improve their statistical skills, particularly in today’s data-driven world. This comprehensive guide aims to delve into the nuances of interpreting standard deviation, providing insights into its applications in statistics, data analysis, and research methods. Whether you are a student or a professional, strengthening your understanding of this measure of variability will enable better decision-making based on statistical data. Let’s expand our knowledge on this crucial concept!
What is Standard Deviation?
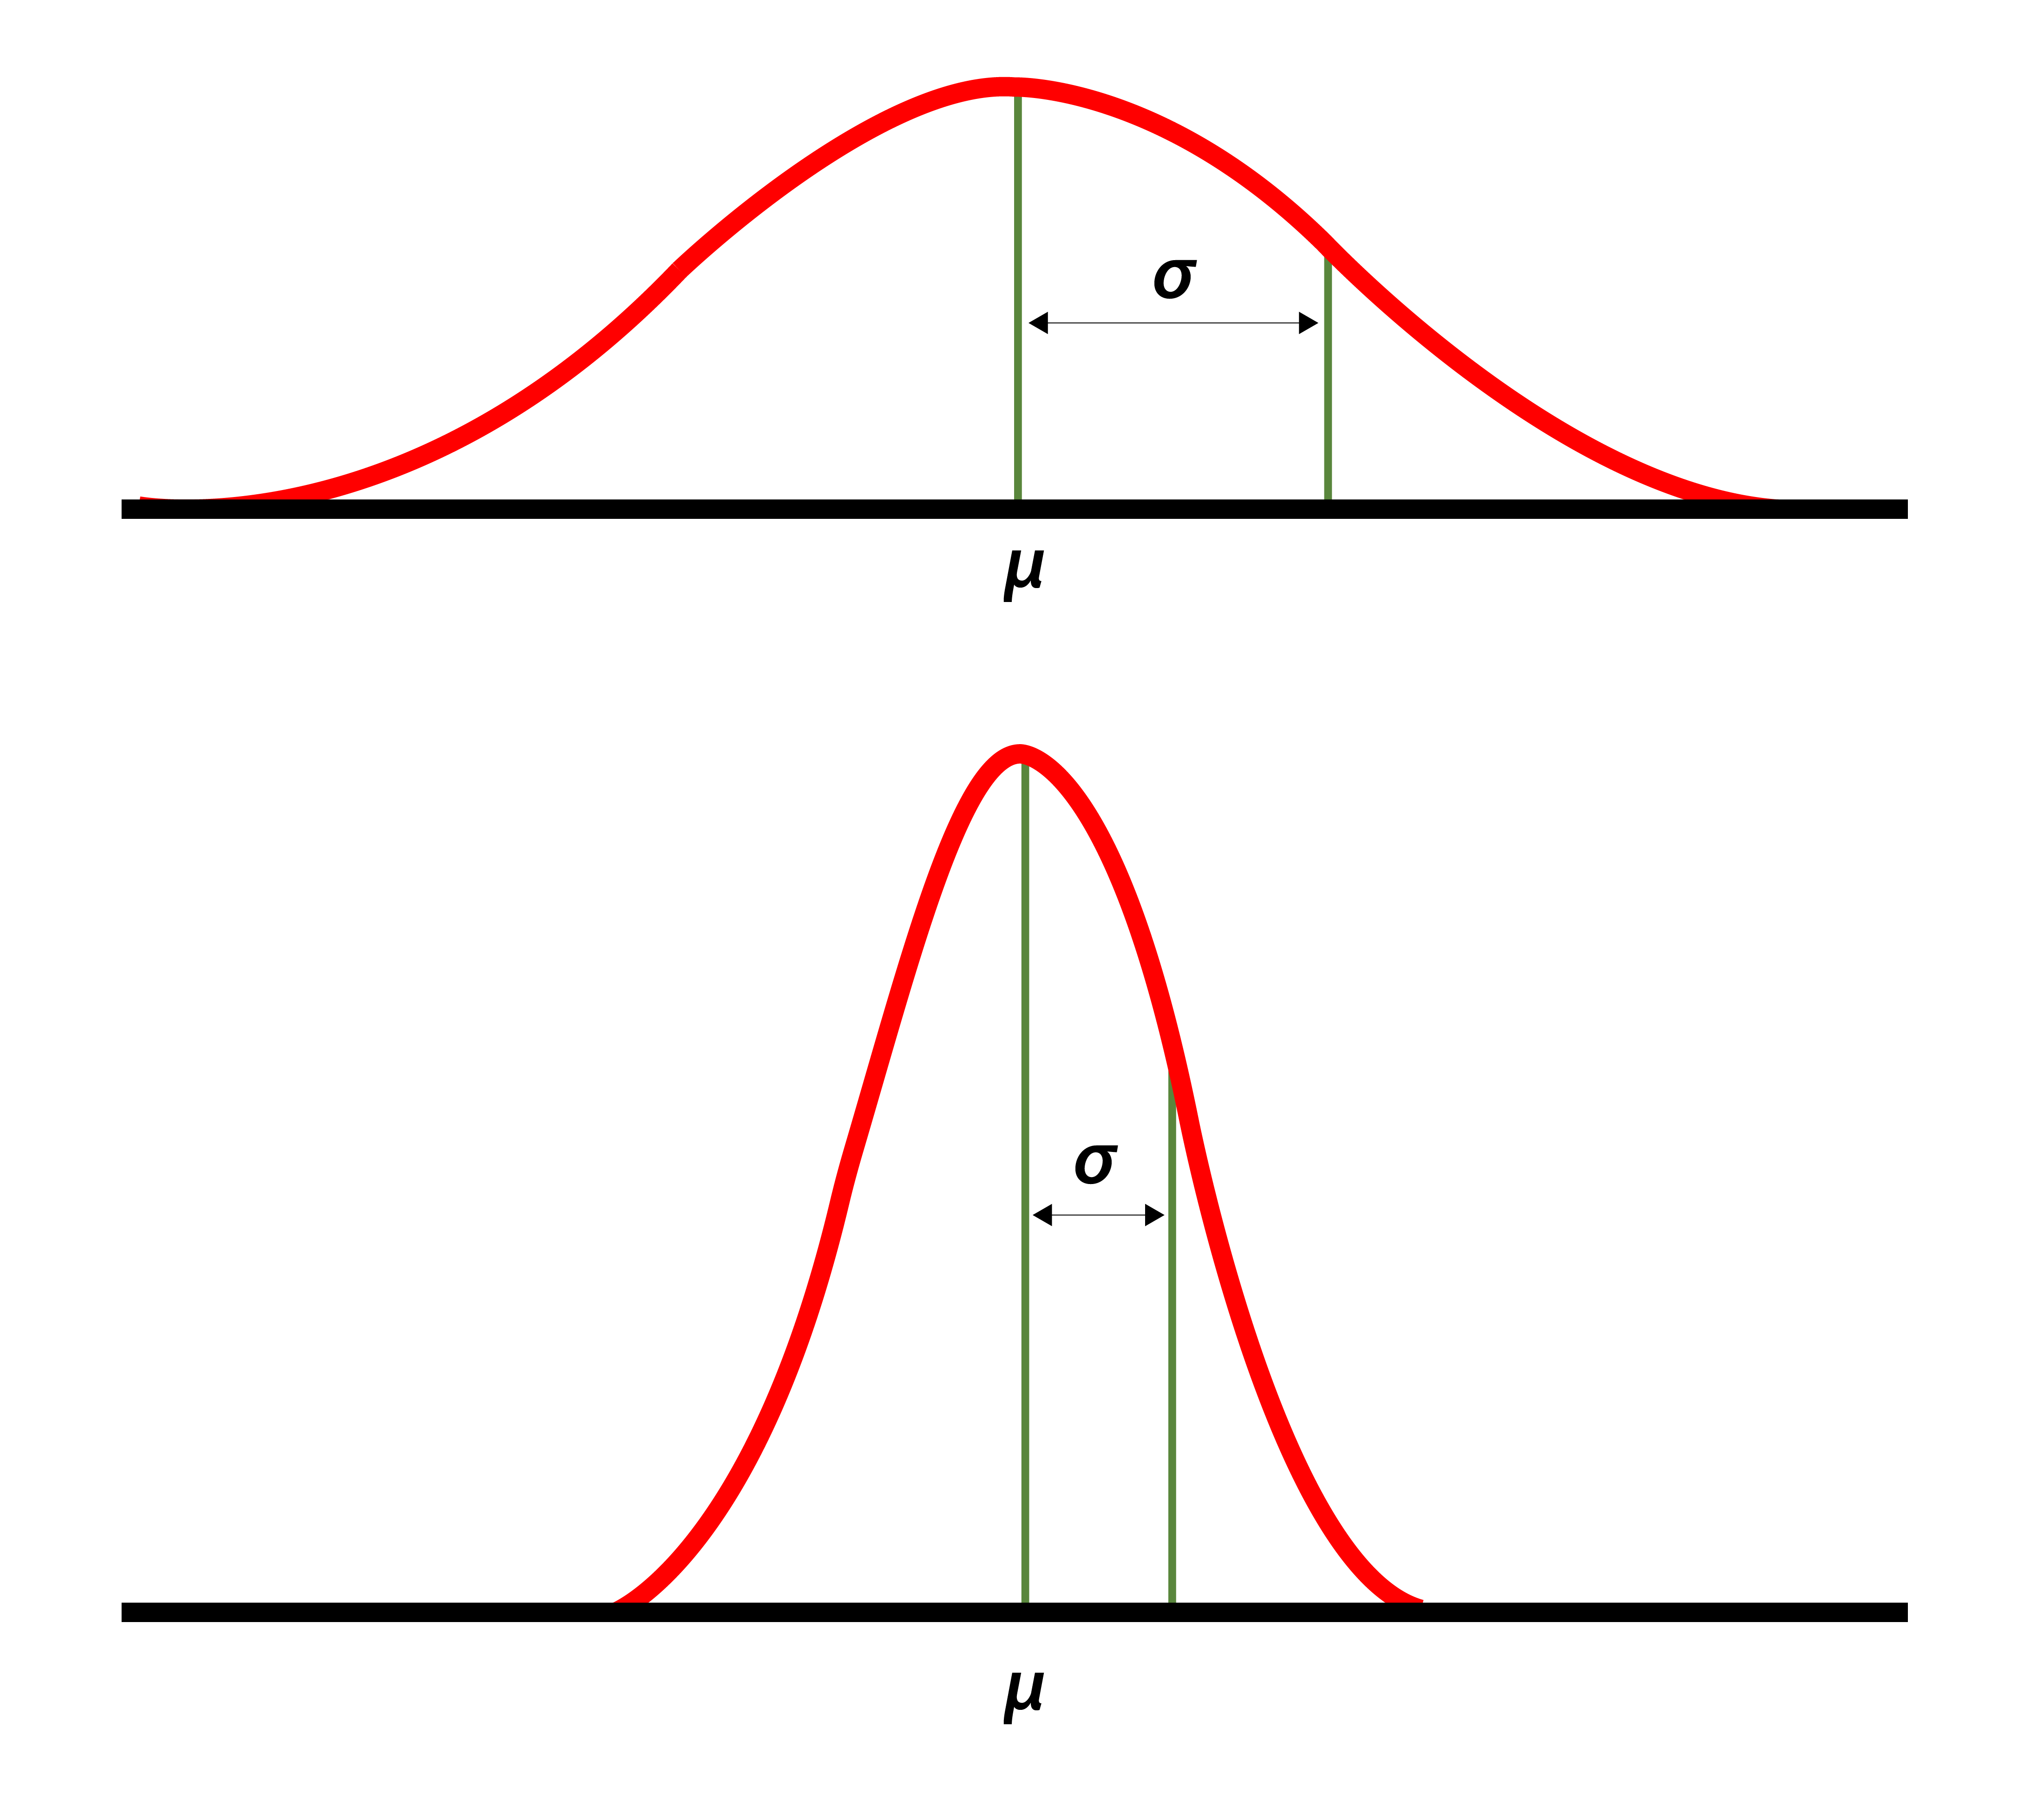
Standard deviation is a fundamental statistical measure that quantifies the amount of variability or dispersion in a dataset. In simpler terms, it tells us how much the individual data points in a dataset vary from the mean or average value. A low standard deviation indicates that the data points are close to the mean, whereas a high standard deviation means that the data points are spread out over a wider range of values. This measure is critical for understanding the spread of data and plays a vital role in the realm of data analysis.
Population vs Sample Standard Deviation
Understanding the difference between population standard deviation and sample standard deviation is key in statistical analysis. The population standard deviation is used when you have data from an entire population, whereas the sample standard deviation is used when data is collected from a subset of the population. The formulae for these calculations differ slightly; the population standard deviation uses all data points while the sample standard deviation introduces Bessel’s correction (dividing by N-1) to account for the estimation error introduced by using a sample rather than the full population.
Why Standard Deviation Matters
Standard deviation is significant because it provides context to the mean of a dataset. For instance, in the field of academic research, a study may demonstrate a mean test score, but without understanding the standard deviation, the real implications of that mean remain unclear. In business performance analysis, knowing the variability of sales revenue can help organizations implement strategies that target stability or growth. Thus, this metric not only acts as a critical statistical measure but also plays a vital role in making informed business decisions.
Practical Example of Calculating Standard Deviation
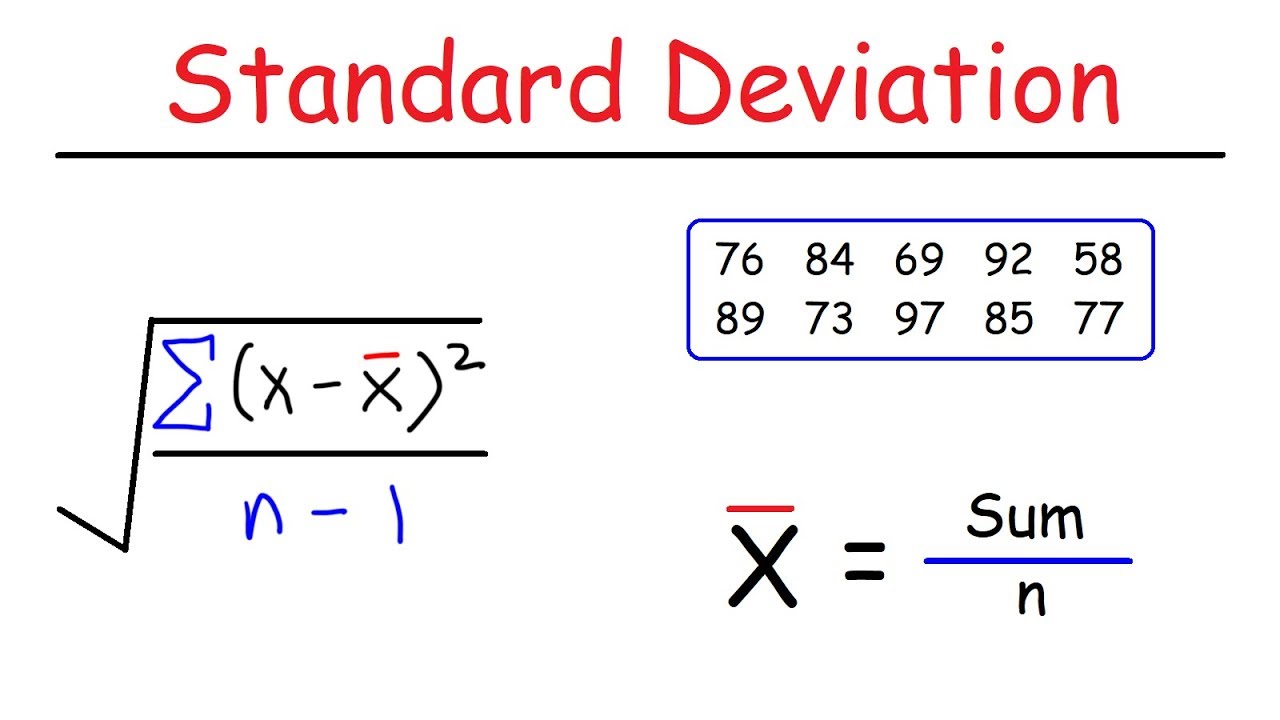
Let’s consider a simple example to illustrate how to calculate standard deviation. Assume you have the following dataset representing exam scores: 85, 87, 88, 90, and 95. To find the standard deviation, you first calculate the mean (average): (85 + 87 + 88 + 90 + 95)/5 = 89. Next, you subtract the mean from each score and square the result: (85-89)², (87-89)², (88-89)², (90-89)², (95-89)². The squared differences are then summed and divided by the number of data points (or number minus one for a sample standard deviation) to find the variance. Finally, take the square root of the variance to find the standard deviation.
Interpreting Standard Deviation in Data Analysis
Interpreting standard deviation is crucial for any data interpretation task. It allows researchers to understand how much variation exists in a dataset and how individual scores relate to the mean performance. In practical terms, knowing the standard deviation helps determine if the results are statistically significant or if they fall within acceptable fluctuation ranges determined by the chosen significance level.
Linking Standard Deviation to Normal Distribution
When assessing datasets, it’s important to note the relationship between standard deviation and the normal distribution. In a normally distributed dataset, approximately 68% of values fall within one standard deviation from the mean, while about 95% lie within two standard deviations. This rule of thumb provides critical context when dealing with any form of quantitative analysis because it aids in identifying outliers and understanding the overall distribution of data. Understanding this link assists data analysts in drawing meaningful conclusions when analyzing complex datasets.
Importance of Standard Deviation in Statistical Significance
In research studies, establishing statistical significance often relies on understanding standard deviation. It helps determine whether the observed results can be attributed to actual differences or whether they are likely due to chance. Utilizing statistical tools like confidence intervals and hypothesis testing, standard deviation assists in evaluating the robustness of research findings. For instance, if the standard deviation of test results is low, one can conclude there is a strong consistency in performance, indicating statistical validity. Conversely, a high standard deviation may prompt researchers to question the reliability of their findings.
Applications of Standard Deviation in Various Fields
The applications of standard deviation span several disciplines, making it one of the most utilized calculations in statistics. In fields such as finance, standard deviation serves as a risk measure by evaluating the volatility of asset prices. Similarly, in healthcare research, understanding variability can help pinpoint treatment effectiveness across different population segments. Let’s explore how standard deviation applies in real-world situations across various domains.
Standard Deviation in Finance
In finance, measuring the standard deviation of an investment’s returns is essential for assessing its risk profile. A higher standard deviation might indicate a more volatile investment, while a lower standard deviation often suggests stability. Investors leverage this information when constructing portfolios, aligning their risk tolerance with expected returns. This application of standard deviation is vital for effective performance analysis and making informed investment decisions.
Standard Deviation in Education
In the realm of education, descriptive statistics often employ standard deviation to assess student performance. By analyzing test score distributions and their standard deviations, educators can identify trends in student learning and variance. Furthermore, this analysis allows educators to adapt teaching methods to better cater to diverse learning needs, ultimately improving educational outcomes. Consequently, the metric acts as a guiding tool in shaping teaching strategies and enhancing the learning experience.
Standard Deviation in Quality Control
In manufacturing and services, standard deviation is a crucial component of quality control processes. By measuring the variability of production outputs, organizations can determine their process stability and consistency. Implementing strategies based on standard deviation analysis can lead to improved quality, reduced waste, and enhanced operational efficiency. Therefore, understanding this metric is paramount for businesses aiming to maintain high standards and continuous improvement.
Key Takeaways
- Standard deviation quantifies the variability in a dataset, providing valuable insights into how individual data points relate to the mean.
- Understanding the difference between population and sample standard deviation is crucial for accurate statistical analysis.
- The relationship between standard deviation and normal distribution helps in identifying outliers and ensuring statistical significance.
- Standard deviation has diverse applications across various fields, such as finance, education, and quality control.
- Relying on this measure can enhance decision-making processes and result interpretation across industries.
FAQ
1. What is the standard deviation formula?
The standard deviation formula depends on whether you are dealing with a population or a sample. For a population, the formula is: σ = √(Σ(x_i – μ)² / N), where μ is the mean, N is the number of observations, and x is each data point. For a sample, it is: s = √(Σ(x_i – x̄)² / (n – 1)), where x̄ is the sample mean, n is the number of sample points, and Σ represents the sum of the squared deviations.
2. How is standard deviation used in research methods?
In research methods, standard deviation is used to assess the variability of data collected from experiments or surveys. It helps researchers measure consistency of observations, gauge the spread of data points, and draw inferences. Utilizing this statistical measure enables researchers to understand the extent to which their findings might differ, making it vital for statistical inference and validation of results.
3. Can standard deviation be negative?
No, standard deviation cannot be negative. Since it involves squaring the deviation of each data point from the mean, the result is always zero or positive. A standard deviation of zero indicates no variability, meaning all data points are identical.
4. What does a higher standard deviation indicate?
A higher standard deviation signifies greater variability in the data set, meaning that the data points are spread out over a larger range of values. In practical scenarios, this may indicate higher uncertainty, more extreme results, or a wider range of performance.
5. How does standard deviation relate to variance?
Standard deviation is the square root of variance. Variance measures the average of the squared differences from the mean, while standard deviation provides a more interpretable measure of variability in the same units as the original data. Understanding both concepts offers a fuller picture of data variability.
6. When would I use sample standard deviation over population standard deviation?
You would use sample standard deviation when your data comprises a sample from a larger population rather than the entire population. This method adjusts for potential biases and provides a more accurate reflection of variability in a sample context, allowing for meaningful comparisons and inferences about the overall population.
7. What role does standard deviation play in descriptive vs inferential statistics?
In descriptive statistics, standard deviation summarizes data to provide insight into variability without making predictions. Conversely, in inferential statistics, it plays a critical role in hypothesis testing and confidence intervals, helping to make conclusions about a population based on a sample.